What Is Load Testing (And Why It's Different From Speed Testing)?
Speed testing and load testing answer two different questions.
Speed testing (tools like GTmetrix or PageSpeed Insights) measures how fast a single page loads for one visitor. It tells you whether your images are optimized, your CSS is minified, and your server responds quickly. If you've read our guide to WordPress TTFB, you've already covered this side.
Load testing measures how your site performs when many visitors arrive at once. It answers questions like:
- Can your server handle 100 concurrent users without slowing down?
- At what point does response time start climbing?
- Does your checkout flow still work under pressure?
- Will your site crash during a product launch or enrollment period?
Think of speed testing as checking how fast your car goes on an empty road. Load testing is checking whether it can maintain that speed in rush hour traffic.
For WordPress sites running WooCommerce stores, membership platforms, or online courses, load testing matters more than for a simple blog. These sites generate dynamic, logged-in pages that can't be served from a static cache. Every page request hits PHP, queries the database, and builds a fresh response. Under traffic, that workload multiplies fast.
When Should You Load Test Your WordPress Site?
You don't need to run load tests every week. But there are specific moments when skipping one is a gamble:
Before a product launch or sale. If you're running a flash sale, launching a new course, or opening enrollment, you want to know your site can handle the spike. Find out during a test, not during the event.
After major infrastructure changes. Switched hosting providers? Upgraded your PHP version? Changed your caching configuration? Load test to confirm the change actually improved things.
Before scaling your ad spend. If you're about to double your Google Ads budget or push a campaign that could go viral, make sure your server can absorb the traffic you're paying to send.
When you notice intermittent slowdowns. If your site feels sluggish at certain times of day, a load test can confirm whether traffic volume is the cause or if something else is going on.
Periodically as you grow. A site that handled 50 concurrent users six months ago might struggle at 150 today if you've added plugins, custom post types, or new features. Test quarterly as a baseline.
The Key Metrics You Need to Understand
Load testing tools generate a lot of data. Here are the numbers that actually matter:
Response Time (Average and P95)
Average response time is the mean time the server takes to respond across all requests during the test. It gives you a general sense of performance.
P95 response time (95th percentile) is more useful. It tells you the response time that 95% of your visitors experience or better. If your average is 400ms but your P95 is 2.8 seconds, that means 1 in 20 visitors is having a terrible experience. Always check P95, not just the average.
| Response Time |
Rating |
| Under 500ms |
Excellent under load |
| 500ms to 1s |
Acceptable for dynamic pages |
| 1s to 3s |
Needs optimization |
| Over 3s |
Visitors are leaving |
Requests Per Second (RPS)
This measures how many HTTP requests your server can process each second. Higher is better. It tells you the raw throughput capacity of your hosting setup.
For reference, Levamo's infrastructure benchmarks at 353 requests per second under load across standardized WordPress testing. That gives you a sense of what well-configured managed hosting can deliver.
Error Rate
The percentage of requests that return errors (500 errors, timeouts, connection failures) during the test. Your target is 0%. If errors start appearing at a specific concurrency level, you've found your breaking point.
Concurrent Users
The number of simulated visitors hitting your site at the same time. This is the variable you control during testing. Start low, ramp up gradually, and watch how response time and error rate change as concurrency increases.
You don't need expensive enterprise software to load test a WordPress site. These tools cover everything from quick browser-based tests to scriptable performance suites.
1. Loader.io (Best for Beginners)
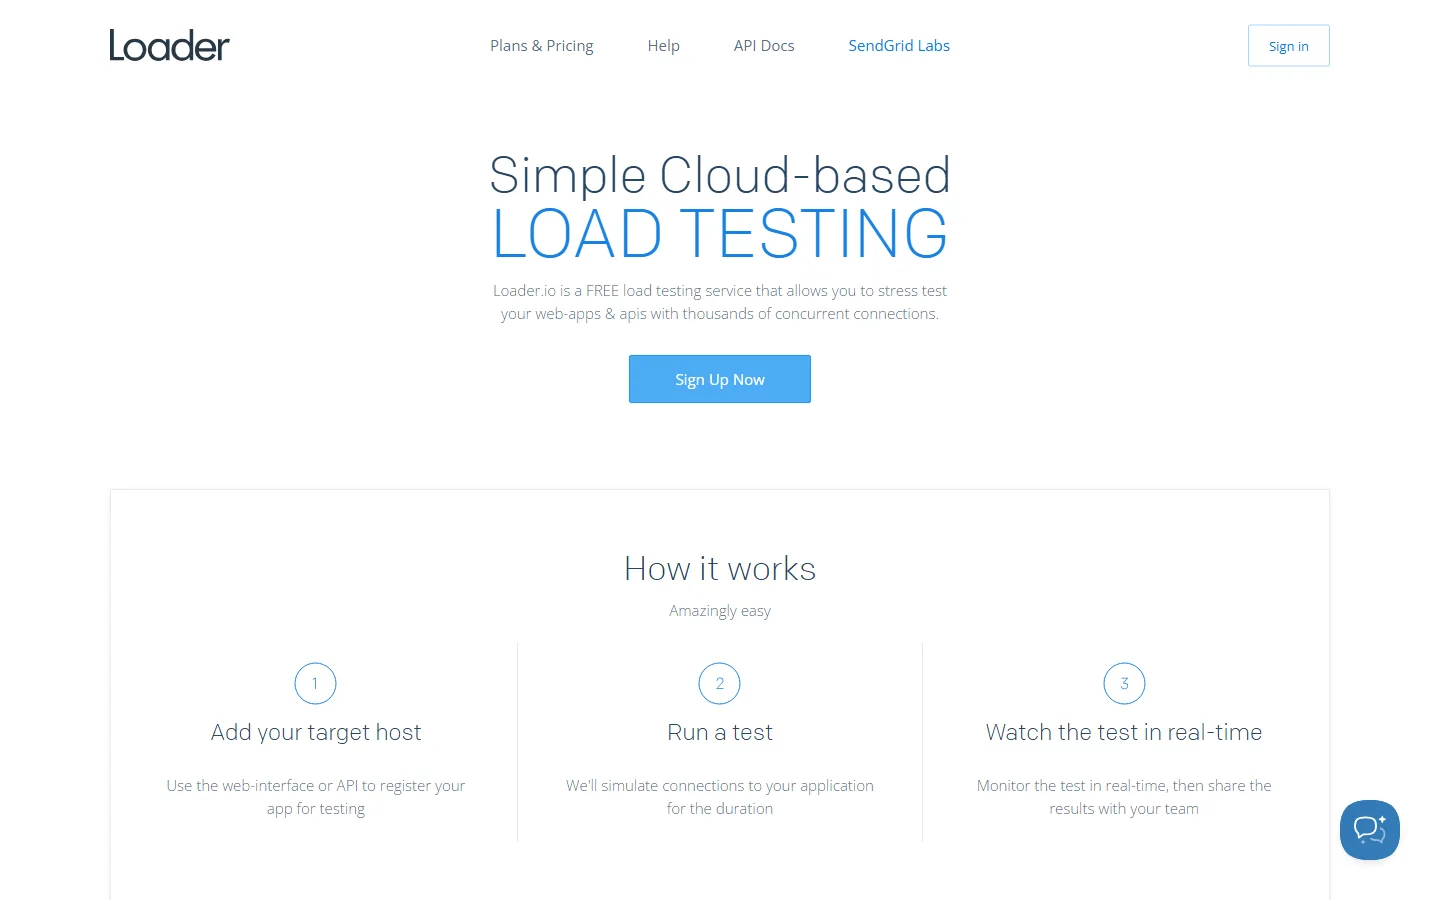
Loader.io is a cloud-based load testing tool with a generous free tier. No installation required, no command line needed.
Free tier includes:
- Up to 10,000 requests per test
- Tests up to 1 minute long
- One target host
How to use it:
- Sign up at loader.io and verify your domain by adding a verification token (a small text file uploaded to your site's root directory, or a DNS record).
- Create a new test. Choose "Clients per test" mode to simulate concurrent users.
- Set your target URL. Start with your homepage, then test critical pages like
/checkout/, /my-account/, or /courses/.
- Set the client count. Start with 50 concurrent users for 1 minute, then increase to 100, 250, and beyond.
- Run the test and watch the response time graph in real time.
What to look for: A flat response time line means your server is handling the load comfortably. A line that curves upward as users increase means you're approaching your server's capacity. Any errors (shown in red) mean your site is failing under that load level.
2. k6 by Grafana Labs (Best for Custom Scenarios)
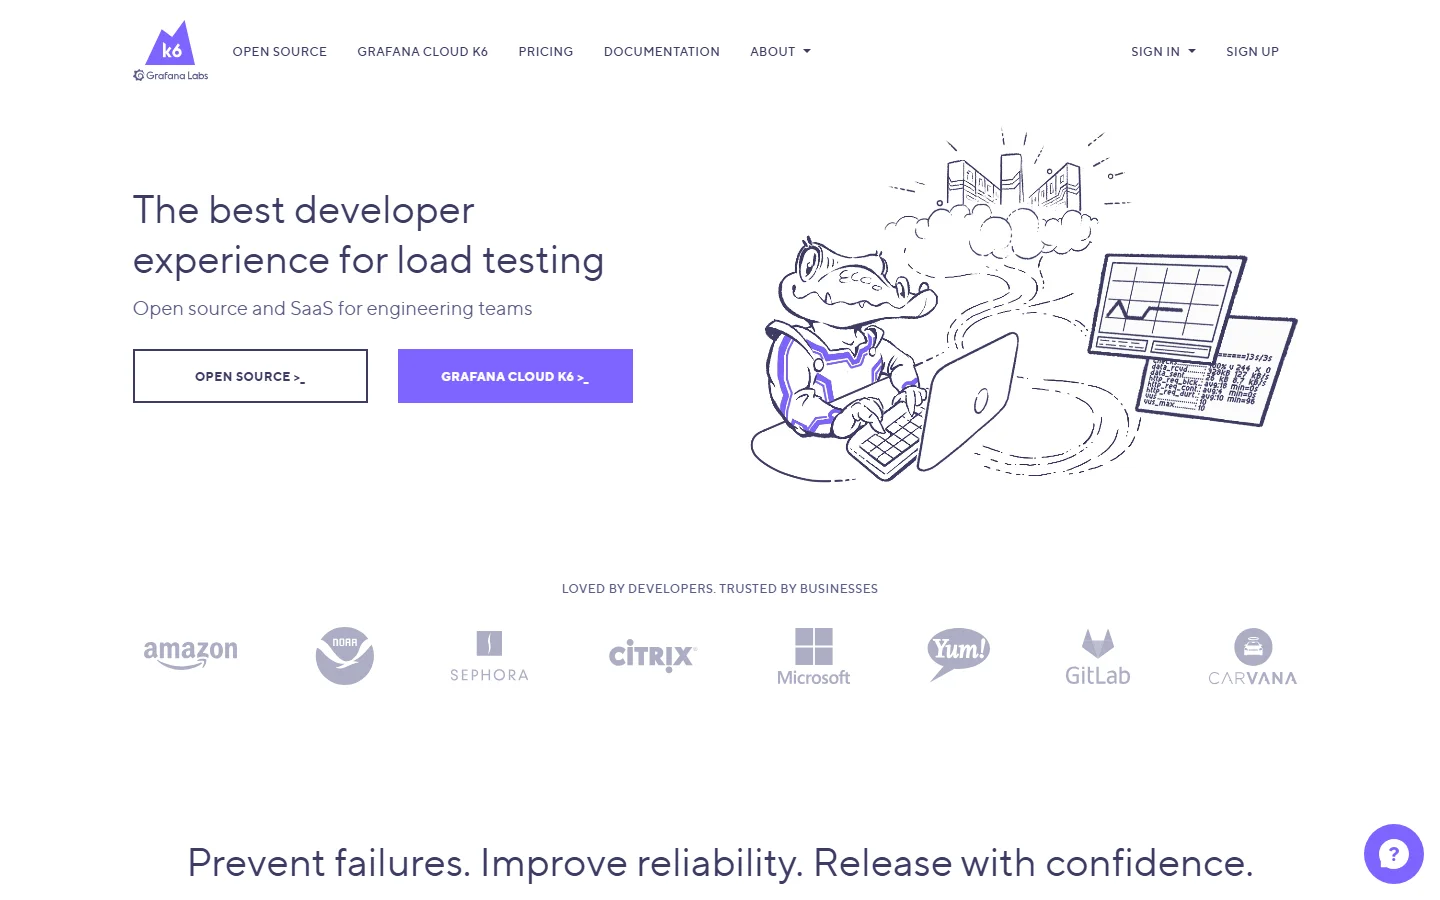
k6 is a free, open-source load testing tool that runs from your local machine. It's more powerful than Loader.io but requires basic comfort with the command line.
Why k6 stands out: You can script realistic user scenarios. Instead of hammering one URL, you can simulate a visitor who browses products, adds to cart, goes to checkout, and completes a purchase. This is invaluable for WooCommerce stores and membership sites where the user journey involves multiple pages.
Quick start:
Install k6 (available on Windows, Mac, and Linux), then create a simple test script:
import http from 'k6/http';
import { sleep } from 'k6';

export const options = {
  stages: [
    { duration: '30s', target: 50 },   // Ramp up to 50 users
    { duration: '1m', target: 50 },    // Hold at 50 users
    { duration: '30s', target: 100 },  // Ramp to 100 users
    { duration: '1m', target: 100 },   // Hold at 100 users
    { duration: '30s', target: 0 },    // Ramp down
  ],
};

export default function () {
  http.get('https://yoursite.com/');
  sleep(1);
  http.get('https://yoursite.com/shop/');
  sleep(2);
  http.get('https://yoursite.com/cart/');
  sleep(1);
}
This script ramps from 0 to 50 users, holds, then ramps to 100, simulating a realistic traffic pattern rather than an instant spike.
Reading k6 output: After the test completes, k6 prints a summary including http_req_duration (response time), http_reqs (total requests), and http_req_failed (error rate). The P95 value under http_req_duration is the number you care about most.
3. LoadForge (Best for WordPress-Specific Testing)
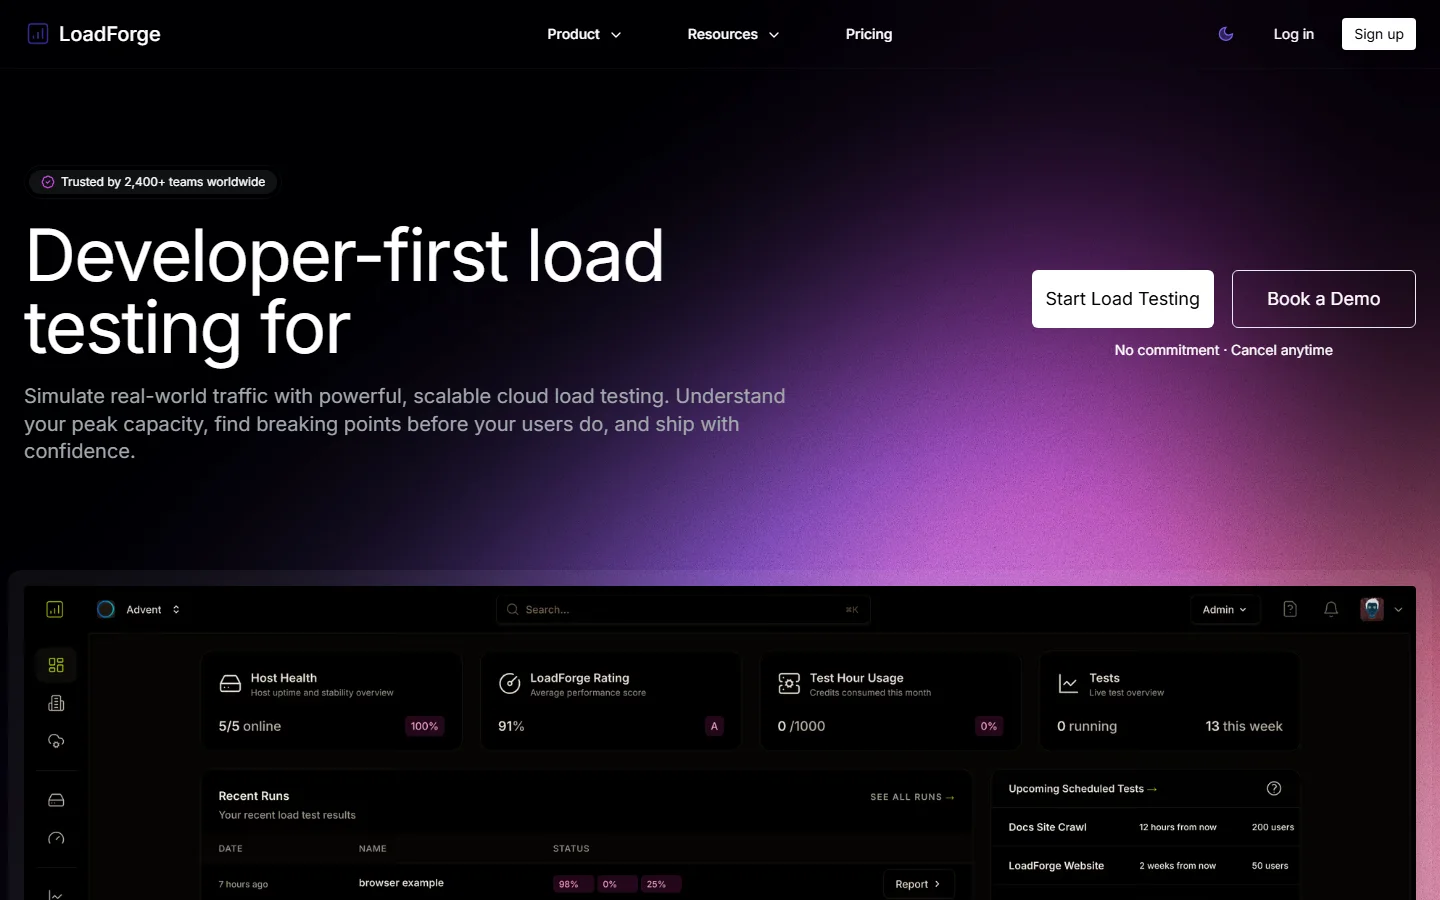
LoadForge is a cloud-based load testing platform purpose-built for web applications. It supports distributed testing from multiple geographic regions and offers WordPress-specific test templates.
Why it's worth a look: LoadForge lets you run tests from multiple locations simultaneously, which better simulates real-world traffic patterns. You can test from the same regions your actual visitors come from, rather than blasting traffic from a single data center.
How to get started:
- Create a free account at loadforge.com.
- Choose a WordPress test template or write your own using their web-based editor.
- Select your test regions (US, Europe, Asia).
- Set your concurrency level and test duration.
- Run the test and review the geographic breakdown of response times.
4. WP Benchmark Plugin (Best for Server-Level Metrics)
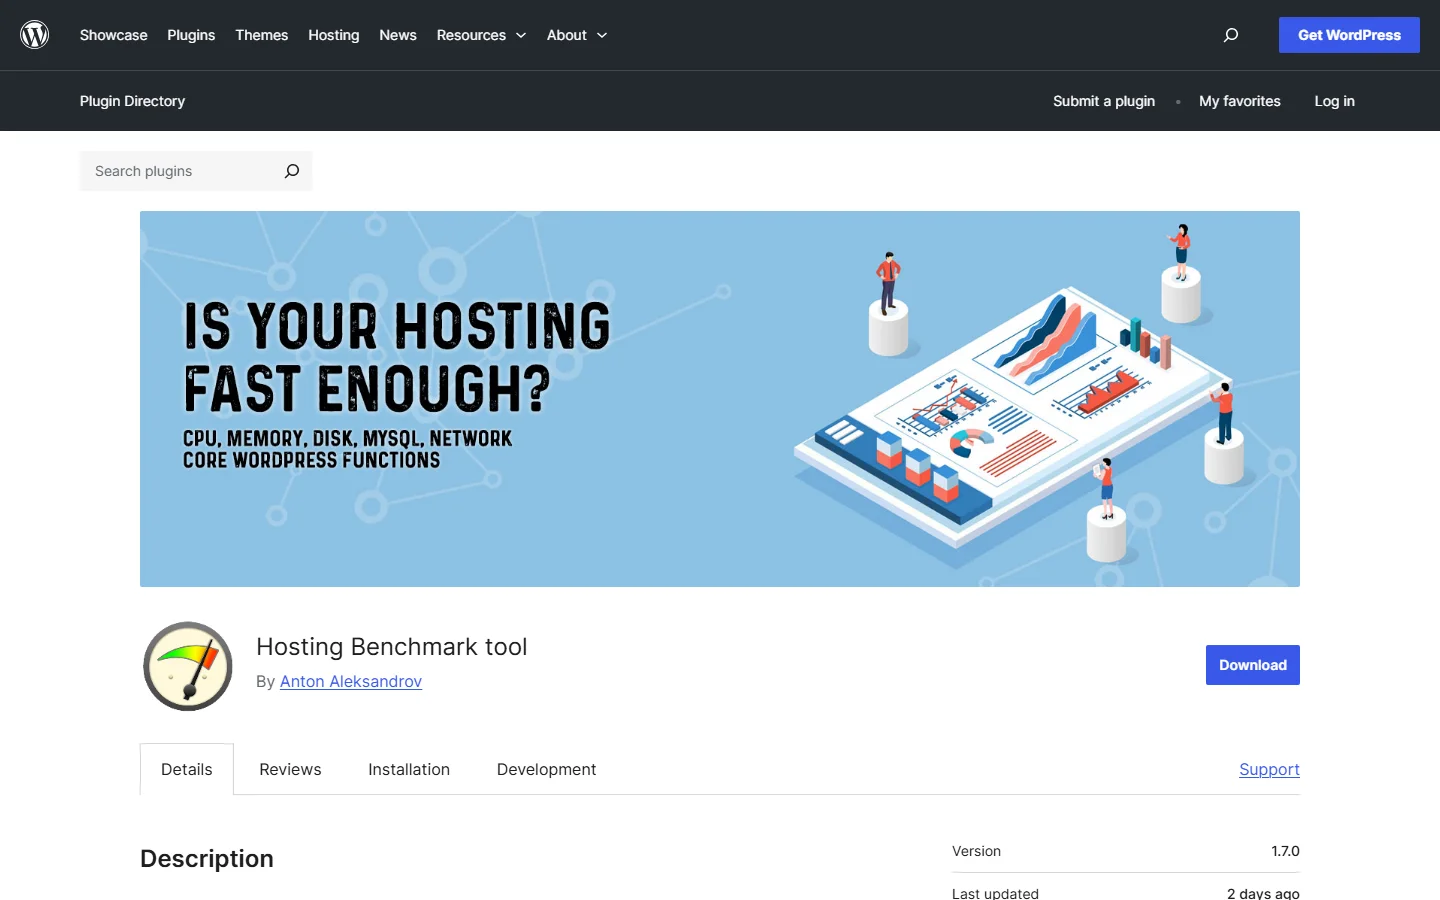
The WP Benchmark plugin runs directly inside WordPress and measures raw server performance: CPU speed, database query throughput, memory operations, and filesystem I/O.
It doesn't simulate visitors, so it's not a load test in the traditional sense. But it gives you a baseline score you can compare against other hosting providers.
How to use it:
- Install and activate the WP Benchmark plugin from your WordPress dashboard.
- Go to Tools > WP Benchmark and click "Run Benchmark."
- The plugin runs a series of standardized tests and produces a score.
For context, Levamo's infrastructure scores 9.3 on WP Benchmark with 2,958 queries per second. You can run the same test on your own hosting to see how your provider compares.
How to Run Your First Load Test (Step by Step)
Here's a practical workflow for your first load test, regardless of which tool you choose:
Step 1: Pick Your Test Pages
Don't just test the homepage. Test the pages that matter most to your business and that generate the heaviest server workload:
- Homepage (baseline comparison)
- Product or course pages (often database-heavy)
- Cart and checkout pages (critical conversion points)
- My Account or member dashboard (logged-in, uncacheable)
- Search results page (database-intensive)
For WooCommerce stores, your checkout page is the most important test target. For LMS sites, test the lesson page with video embeds. For membership sites, test the member dashboard and activity feeds.
Step 2: Set Your Baseline
Run a small test first: 10 concurrent users for 60 seconds. Record the average response time, P95, and error rate. This is your baseline.
Step 3: Ramp Up Gradually
Increase concurrency in stages: 25, 50, 100, 200 users. At each stage, hold for at least 60 seconds to let the server stabilize. Don't jump straight to 500 users because you'll just see everything break without understanding where the performance starts degrading.
Step 4: Identify the Breaking Point
Watch for three warning signs:
- Response time spikes. If average response time jumps from 400ms to 2+ seconds between 100 and 150 users, you know your capacity ceiling.
- Error rate increases. Any HTTP 500 errors or timeouts mean the server is failing under that load.
- Flatlined throughput. If requests per second stop increasing even as you add more users, the server is saturated.
Your "safe capacity" is roughly 80% of the point where response times start climbing steeply. If things degrade at 200 users, plan for a maximum of 160 concurrent users in production.
Step 5: Test Logged-In vs. Logged-Out
This step is critical for membership sites, LMS platforms, and WooCommerce stores. Logged-out pages can often be served from cache, which makes them fast regardless of server capacity. Logged-in pages bypass the cache and require full PHP and database processing on every request.
If your site loads in 200ms when logged out but takes 3 seconds when logged in with 50 users, your caching isn't the problem. Your server resources are.
Most load testing guides skip this distinction. But for dynamic WordPress sites, the logged-in experience is where performance really matters.
How to Read Your Results
After running your tests, you'll have a collection of numbers. Here's how to interpret them:
The Good Scenario
Response time stays flat as concurrency increases. Error rate stays at 0%. Requests per second scale linearly with users added. Your server has headroom.
Example: 50 users = 350ms average, 100 users = 380ms average, 200 users = 420ms average, 0% errors throughout. This site handles load well.
The Warning Scenario
Response time increases gradually. No errors yet, but the trend line is heading in the wrong direction. You have time to optimize before it becomes a problem.
Example: 50 users = 400ms, 100 users = 900ms, 200 users = 1.8s, 0% errors. Response time is climbing. You'll likely see errors if traffic grows another 50%.
The Problem Scenario
Response time spikes sharply at a specific concurrency level. Errors start appearing. Requests per second plateau or drop.
Example: 50 users = 350ms, 100 users = 600ms, 150 users = 4.2s with 12% error rate. This site hits a wall at around 120 concurrent users.
What to Do When Load Tests Reveal Problems
Poor load test results usually point to one of these bottlenecks:
Database Bottleneck
Symptoms: Response times climb steeply under load. Slow query log fills up. Admin dashboard becomes unresponsive.
Fixes:
- Enable object caching (Redis or KeyDB) to reduce repeated database queries. On Levamo, KeyDB + Redis object caching is included on Business plans and above, purpose-built for the kind of repeated queries that membership and WooCommerce sites generate.
- Clean up post revisions, transients, and orphaned metadata.
- Add database indexes for custom queries from plugins.
- Check for plugins running unoptimized queries (Query Monitor plugin helps identify these).
PHP Processing Bottleneck
Symptoms: CPU usage maxes out. Requests queue up waiting for PHP workers. Timeout errors appear.
Fixes:
- Ensure you're running PHP 8.2 or later (significant performance gains over PHP 7.x).
- Audit plugins. Deactivate them one by one during load tests to identify which ones consume the most resources.
- Choose hosting with auto-scaling PHP workers that add capacity under load rather than hitting a fixed cap.
Caching Gaps
Symptoms: Every request takes the same amount of time regardless of whether the page has been visited before. No variation between first and repeat visits.
Fixes:
- Enable page caching for logged-out visitors (LiteSpeed Cache, WP Super Cache, or your host's built-in solution).
- Enable object caching for logged-in visitors.
- Implement a CDN to serve static assets from edge locations closer to your visitors. Levamo includes Enterprise Cloudflare CDN with 300+ edge locations on all plans.
Infrastructure Ceiling
Symptoms: You've optimized everything you can at the application layer, but response times still degrade under moderate load.
Fixes:
- This is a hosting problem. Your server simply doesn't have enough CPU, RAM, or I/O throughput for your workload.
- Consider upgrading your plan or switching to hosting built for dynamic, logged-in WordPress workloads.
- Look for hosting that publishes transparent benchmarks so you can compare before you commit. Levamo publishes its full performance benchmarks, including 353 requests per second under load and 2,958 database queries per second.
Load Testing Best Practices
A few guidelines to get clean, actionable results:
Test against a staging environment first. Running a load test against your production site during business hours can slow things down for real visitors. Use a staging environment to test safely. On Levamo, one-click staging is available on all plans.
Run tests during off-peak hours. If you must test against production, do it when traffic is naturally low (early morning or late night in your primary timezone).
Disable rate limiting temporarily. Cloudflare, security plugins, or your host's firewall may block load test traffic because it looks like an attack. Whitelist your testing tool's IP addresses or pause rate limiting during the test.
Test from a location near your server. Network latency between the test origin and your server adds noise to your results. If your server is in US East, run the test from a US East location for the cleanest data. Test from other regions separately to measure CDN effectiveness.
Run multiple tests and average the results. A single test can be skewed by temporary network conditions. Run at least three tests at each concurrency level and use the average.
Document your results. Record the date, tool, concurrency levels, test URLs, and results in a spreadsheet. This gives you a baseline to compare against future tests and shows whether changes you make actually improve performance.
How Levamo's Stack Handles Load
Performance testing is how you verify hosting claims. Here's what Levamo's infrastructure delivers under standardized testing:
| Metric |
Levamo Score |
| WP Benchmark Score |
9.3 |
| Database Queries/Second |
2,958 |
| Requests/Second Under Load |
353 |
| GTmetrix Performance |
95% |
These numbers come from independent benchmarks, and you can replicate them using the tools in this guide. That's the point: don't take any hosting provider's word for it. Test it yourself.
The stack behind those numbers matters for load testing context:
- LiteSpeed web server handles concurrent connections more efficiently than Apache and most Nginx configurations, especially under the heavy PHP workloads WordPress generates.
- KeyDB + Redis object caching (Business plans and above) stores frequently accessed database queries in memory, reducing database load during traffic spikes. This is especially impactful for WooCommerce stores and membership sites where every logged-in page request queries the database.
- Auto-scaling PHP workers add processing capacity automatically when traffic increases, instead of hitting a fixed worker limit and queuing requests.
- MariaDB delivers faster query execution than standard MySQL for WordPress workloads, which matters most during load tests that stress the database layer.
- Enterprise Cloudflare CDN (all plans) serves static assets from 300+ global edge locations, offloading bandwidth from your origin server so it can focus on processing dynamic requests.
- Container isolation ensures other customers on the same server can't steal your resources during traffic spikes.
If you're running a WooCommerce store, membership community, or course platform on Levamo, you can verify these numbers yourself. Run WP Benchmark from your dashboard, then hit your site with Loader.io or k6 and compare.
Wrapping Up
Speed testing tells you how fast your site loads for one person. Load testing tells you whether it stays fast when your traffic actually shows up.
Most WordPress site owners never run a load test. They find out about capacity problems the hard way: during a product launch, a flash sale, or the morning their social post goes semi-viral. By then, the lost revenue and frustrated visitors are already in the rearview mirror.
The tools in this guide are free. The time investment is about 30 minutes for your first test. And the insight you get, knowing exactly how many concurrent visitors your site can handle before things degrade, is the kind of information that lets you scale confidently instead of hoping for the best.
Pick a tool, test your critical pages, and find your breaking point before your visitors do.