What Is TTFB (Time to First Byte)?
TTFB stands for Time to First Byte. It measures the time between a visitor's browser requesting your page and the moment the first byte of data arrives back from the server.
Think of it like ordering food at a restaurant. You place the order (the browser sends a request), the kitchen prepares it (the server processes the page), and the waiter brings out the first plate (the first byte arrives). TTFB is the total wait time from ordering to seeing that first plate.
Here's what happens during that window:
- DNS lookup: The browser translates your domain name into an IP address
- TCP connection: The browser and server establish a connection
- TLS handshake: If your site uses HTTPS (it should), encryption is negotiated
- Server processing: WordPress runs PHP, queries the database, loads plugins, and assembles the HTML
- Response transmission: The server sends back the first byte of the finished page
Steps 1 through 3 are network overhead. Step 4 is where WordPress sites lose the most time. Step 5 depends on the physical distance between the server and the visitor.
Why TTFB Matters More Than You Think
It's the Foundation of Every Other Speed Metric
TTFB is the starting line for everything that happens next in the browser. Your page can't start rendering until the first byte arrives. CSS can't load. JavaScript can't execute. Images can't begin downloading. Nothing happens until TTFB completes.
That's why TTFB directly impacts Largest Contentful Paint (LCP), one of Google's three Core Web Vitals. If your TTFB is 1.2 seconds, your LCP physically cannot be faster than 1.2 seconds. In practice, it'll be much slower because rendering, resource loading, and layout work all stack on top of TTFB.
A TTFB over 600ms is widely considered an LCP killer. Even if you compress every image, minify every script, and lazy-load everything below the fold, a slow server response will bury your scores.
Google Uses It as a Ranking Signal
Core Web Vitals became a confirmed Google ranking factor in 2021. While content quality and relevance still dominate, page experience metrics serve as a meaningful tiebreaker when competing pages are otherwise similar.
Sites that pass all three Core Web Vitals thresholds consistently outperform those that don't. Studies from 2025 and 2026 show that comprehensive Core Web Vitals optimization typically produces organic traffic increases of 12 to 20 percent.
TTFB isn't a Core Web Vital itself, but it's the upstream bottleneck that determines whether you pass LCP. Fix TTFB, and LCP usually fixes itself.
Visitors Won't Wait
Research consistently shows that each additional second of load time increases bounce rates. A page that takes 3 seconds to start rendering loses roughly 32% of visitors compared to a page that renders in 1 second. And TTFB is the first chunk of that load time.
For WooCommerce stores, membership sites, and course platforms, slow TTFB hits revenue directly. Every second of delay means fewer signups, fewer purchases, and more abandoned carts.
What's a Good TTFB? The Benchmarks You Should Know
Not all TTFB targets are equal. Here's how to read the numbers:
| TTFB Range |
Rating |
What It Means |
| Under 200ms |
Excellent |
Elite performance. Your server responds almost instantly. |
| 200 to 600ms |
Good |
Solid performance. Most visitors won't notice any delay. |
| 600 to 800ms |
Needs improvement |
Google's threshold. You'll start seeing LCP problems. |
| Over 800ms |
Poor |
Visitors are waiting. Search rankings may suffer. |
| Over 1,800ms |
Critical |
Google flags this as a failing score. Immediate action needed. |
Google's official threshold marks TTFB under 800ms as "good" for Core Web Vitals purposes. But here's the thing: that's a minimum bar, not a target.
Only about 65% of WordPress sites pass even that generous 800ms benchmark. The top-performing WordPress sites aim for under 200ms, and that's the target this guide will help you hit.
How Hosting Providers Stack Up
Independent benchmark testing across 30 WordPress hosting providers in 2025 revealed wide TTFB variation:
- Best performers: Sub-400ms average TTFB
- Mid-range: 400 to 550ms
- Below average: 550ms and above
The gap between the best and worst providers was over 500ms. That's half a second of performance difference determined entirely by where your site lives, before you've optimized a single thing.
Why WordPress TTFB Is Often Slow
WordPress is a dynamic CMS. Unlike a static HTML site that just serves a pre-built file, WordPress builds every page on the fly. Here's the processing chain that runs on every single uncached request:
- PHP execution: WordPress core, your theme, and every active plugin load their PHP files
- Database queries: WordPress queries MariaDB or MySQL for post content, options, user data, menus, widgets, and metadata. A typical page can run 50 to 200+ database queries.
- Plugin overhead: Each plugin can add its own queries, file reads, and processing logic. Some plugins add 100ms+ to every request.
- Theme rendering: Your theme assembles the final HTML using template files, functions, and conditional logic
- Hook execution: WordPress runs dozens of action and filter hooks, giving plugins a chance to modify output at every stage
On a basic shared host, this entire chain can take 1 to 3 seconds. On a well-configured managed host with proper caching, it takes under 200ms, or the cached version skips most of these steps entirely.
Dynamic Sites Have It Harder
If you run a WooCommerce store, membership site, LMS, or community platform, your TTFB challenge is bigger. These sites serve logged-in users who see personalized content: their cart, their course progress, their profile, their membership level.
Page caching (the biggest TTFB win for simple sites) often can't be used for logged-in pages because the content is different for every user. That means the full WordPress processing chain runs on every request for every logged-in visitor.
This is exactly where object caching, fast databases, and server-level optimization become critical.
How to Measure Your TTFB
Before you optimize, you need a baseline. Here are the best tools for measuring WordPress TTFB:
1. Google PageSpeed Insights (Free)
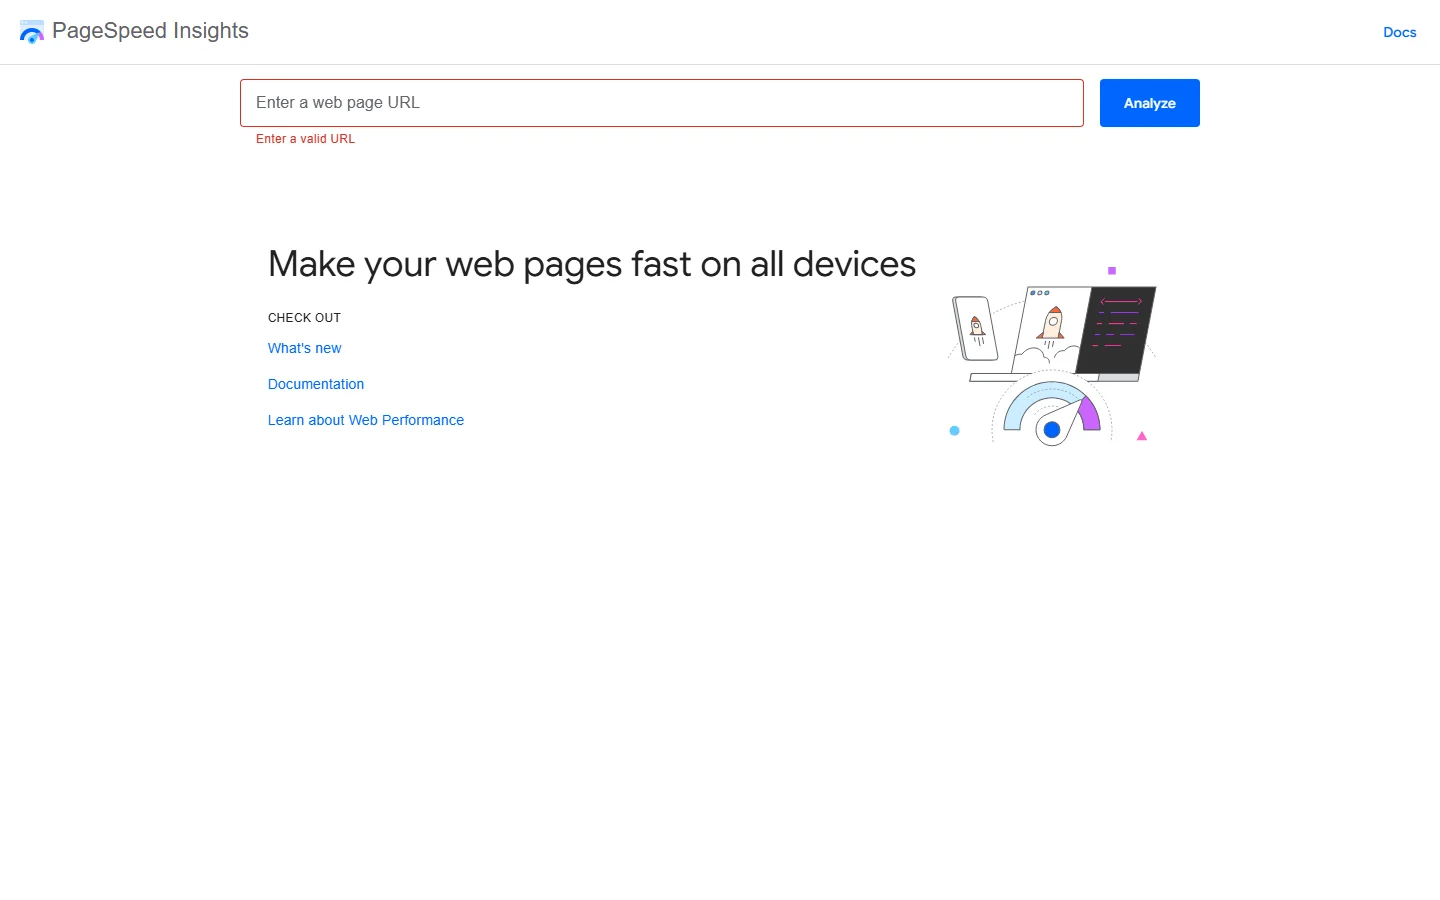
Go to pagespeed.web.dev, enter your URL, and check the Diagnostics section. Look for "Initial server response time was short" (you want to see this) or "Reduce initial server response time" (this means your TTFB needs work).
PageSpeed Insights shows both lab data (simulated test) and field data (real user measurements from Chrome users). Field data is more reliable because it reflects actual visitor experience.
2. GTmetrix (Free Tier Available)
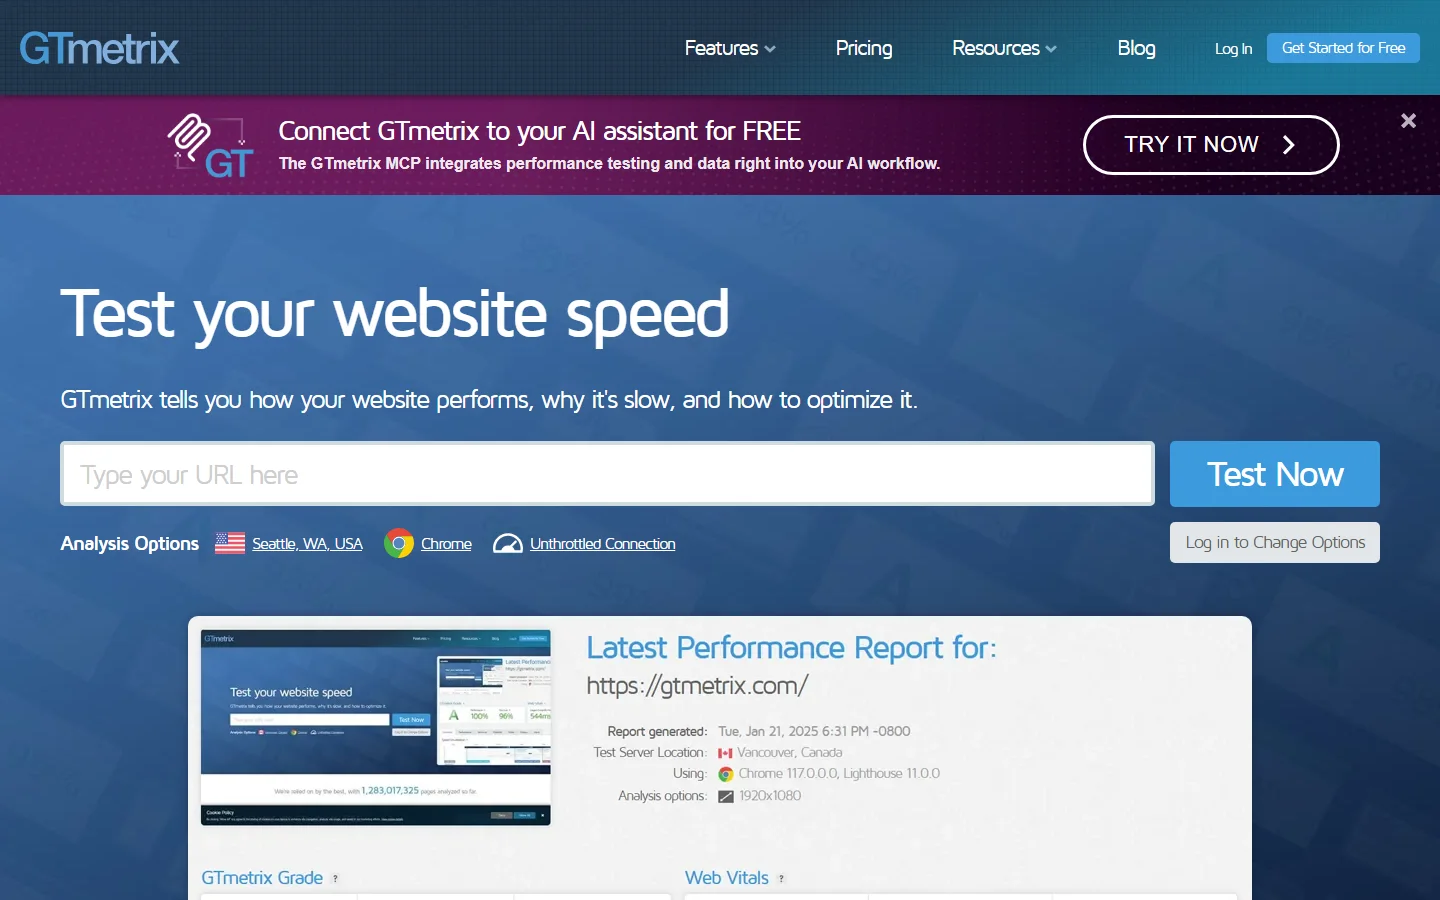
GTmetrix shows TTFB prominently in its Waterfall chart. The first entry in the waterfall is your HTML document, and the green "Waiting" segment is your TTFB.
Pro tip: Test from multiple locations. Your TTFB from a server in Dallas will be very different from a test in Sydney if your server is in Virginia.
3. WebPageTest (Free)
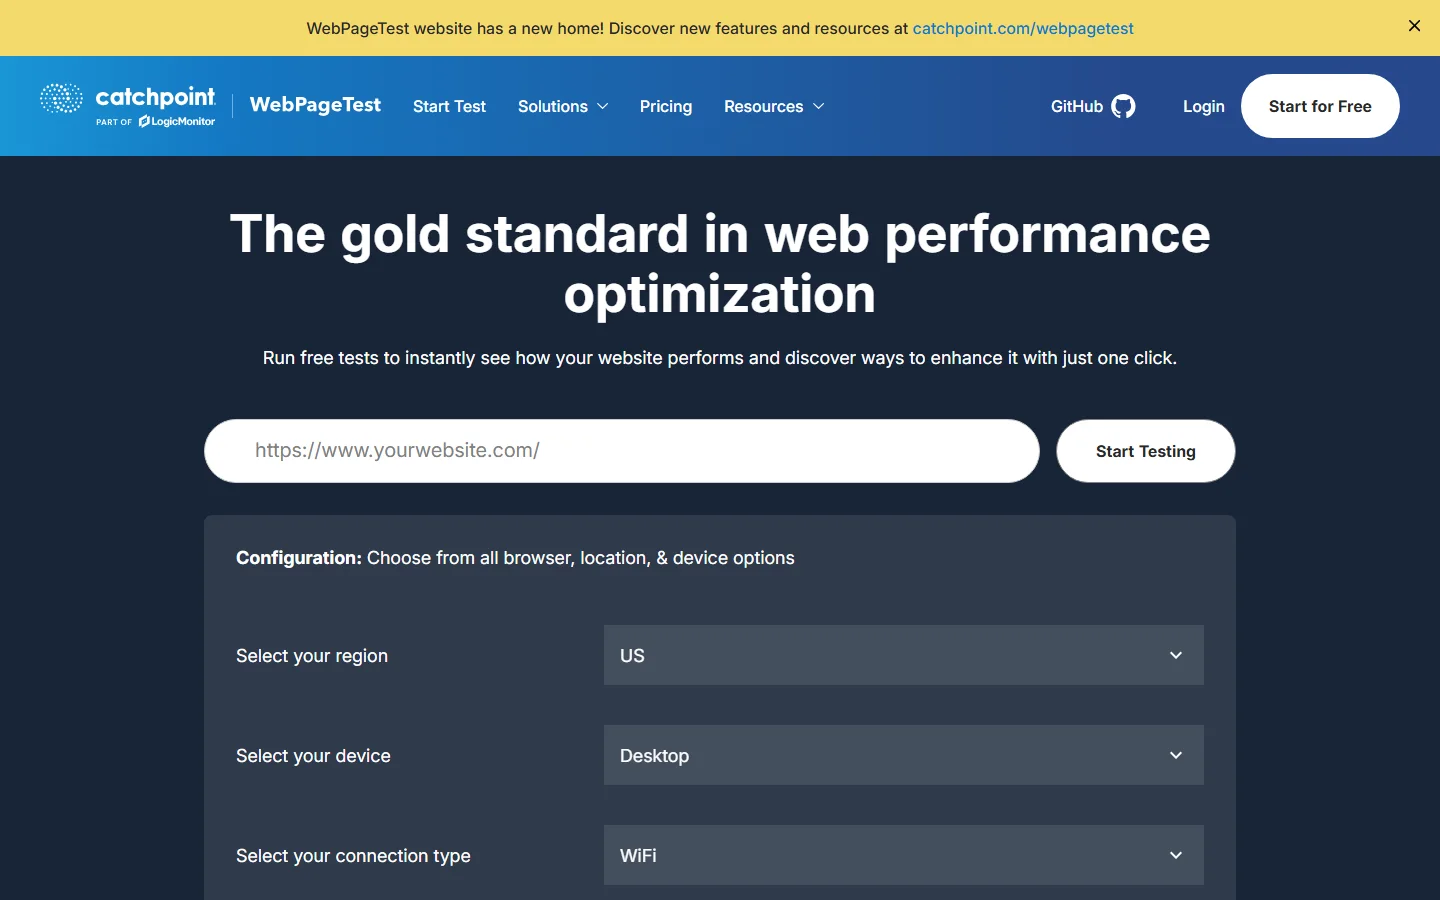
WebPageTest at webpagetest.org provides the most detailed TTFB breakdown. It separates DNS lookup, TCP connection, TLS negotiation, and server processing time so you can see exactly where the delay lives.
Open DevTools (F12), go to the Network tab, reload the page, and click the first HTML request. The Timing tab shows "Waiting for server response," which is your TTFB.
This is the fastest way to spot-check during development, but don't rely on it for benchmarking. Your local network, VPN, and browser extensions all affect the results.
5. cURL From the Command Line
For developers who want a quick, clean measurement, cURL does it in a single line:
curl -o /dev/null -s -w "TTFB: %{time_starttransfer}s\n" https://yoursite.com
This gives you the raw TTFB in seconds without any browser overhead.
What to Watch For When Testing
- Test multiple pages. Your homepage might be cached, but your
/my-account/ or /shop/ page might not be.
- Test logged-in vs. logged-out. Logged-out visitors often get cached pages (fast TTFB). Logged-in users get dynamic pages (slower TTFB).
- Test from multiple locations. A CDN makes TTFB location-dependent. Without one, distance to your origin server dominates.
- Test multiple times. The first request after a cache purge will always be slower. Run 3 to 5 tests and average the results.
How to Get Your WordPress TTFB Under 200ms
Here's where it gets practical. These optimizations are listed in order of impact, from biggest to smallest.
1. Start With the Right Hosting Stack
This is the single biggest factor. No amount of plugin-level optimization can compensate for a slow server.
What to look for in a hosting stack built for low TTFB:
- LiteSpeed web server instead of Apache or Nginx. LiteSpeed handles PHP execution more efficiently and includes built-in server-level page caching through LSCache. Apache is the slowest option. Nginx is faster but requires external caching solutions.
- Modern PHP (8.2+). PHP 8.x is roughly 2 to 3 times faster than PHP 7.4 for WordPress workloads. Every major PHP release brings measurable performance gains.
- MariaDB over MySQL. MariaDB includes query optimizations, better connection handling, and improved performance for the read-heavy query patterns WordPress uses.
- Container isolation. Shared hosting means your site competes for CPU and RAM with hundreds of other customers. Containerized environments give your site dedicated resources, so your TTFB doesn't spike because someone else's site went viral.
- Auto-scaling PHP workers. When traffic spikes, fixed PHP worker pools create a queue. Auto-scaling workers handle the surge without slowing down individual requests.
Levamo's stack checks all of these boxes: LiteSpeed servers, MariaDB, container isolation with dedicated CPU and RAM, and auto-scaling PHP workers. The result is a WP Benchmark score of 9.3 and 2,958 queries per second, which translates directly to low TTFB.
2. Implement Server-Level Page Caching
Page caching is the single most effective TTFB optimization for anonymous visitors. Instead of running the full WordPress processing chain on every request, the server stores the finished HTML and serves it directly.
The difference is dramatic. An uncached WordPress page might take 800ms to generate. The cached version serves in under 50ms.
Server-level caching vs. plugin-based caching:
Plugin-based caching (WP Super Cache, W3 Total Cache) works, but it still loads WordPress before checking the cache. Server-level caching, like LiteSpeed's built-in LSCache, intercepts the request before WordPress even loads. It's faster by design.
If your host runs LiteSpeed, install the LiteSpeed Cache plugin and enable page caching. It integrates directly with the server's cache engine for the fastest possible response.
3. Add Object Caching for Dynamic Pages
Page caching handles anonymous visitors. But what about logged-in users on your membership site, LMS, or WooCommerce store?
Object caching stores the results of database queries in memory (RAM) so WordPress doesn't have to re-run them on every page load. When a logged-in member visits their dashboard, instead of running 150 database queries, WordPress pulls most of those results from the cache in microseconds.
The two main technologies:
- Redis: The industry standard for WordPress object caching. Stable, well-supported, and widely available.
- KeyDB: A Redis-compatible alternative that supports multi-threaded operation, meaning it can handle more concurrent connections without bottlenecking.
Object caching typically reduces TTFB by 30 to 50% on dynamic, logged-in pages. For sites with heavy database usage (WooCommerce with thousands of products, BuddyPress communities, LearnDash courses), the improvement can be even larger.
On Levamo, KeyDB and Redis object caching is included on Business plans and above, purpose-built for the logged-in workloads where object caching matters most.
4. Use a CDN With Edge Caching
A Content Delivery Network stores cached copies of your pages at edge servers around the world. When a visitor in London requests your page, they get it from a nearby edge server instead of your origin server in Virginia.
This slashes the network portion of TTFB (DNS lookup, TCP connection, TLS handshake) from hundreds of milliseconds to single digits.
Not all CDNs are equal:
- Basic CDNs cache only static assets (images, CSS, JS). They help with overall page load but don't reduce TTFB for the HTML document itself.
- Full-page edge caching caches the entire HTML response at the edge. This is what actually reduces TTFB for anonymous visitors to near-zero, because the origin server isn't even contacted.
Cloudflare Enterprise, for example, offers full HTML edge caching across 300+ global locations. The visitor's browser connects to the nearest edge, gets the cached page, and the entire transaction completes in milliseconds.
One Levamo customer running Easy Digital Downloads reported that "our time to first byte was cut in half, if not more, right out of the gate" after moving to Levamo's Cloudflare Enterprise CDN, which is included on all plans.
5. Optimize Your Database
Even with object caching, your database needs to be healthy. Bloated databases slow down the queries that do run.
Quick wins:
- Delete post revisions. WordPress saves every draft revision by default. A site with 500 posts can accumulate 5,000+ revision entries. Limit revisions by adding
define('WP_POST_REVISIONS', 5); to your wp-config.php.
- Clean up transients. Expired transients pile up in the
wp_options table. Use a plugin like WP-Optimize or run a database cleanup periodically.
- Optimize the
wp_options table. This table is queried on every single page load. If it's bloated with autoloaded data from deleted plugins, every request pays the penalty. Check autoloaded data size and remove orphaned entries.
- Add proper indexes. For WooCommerce stores and membership sites with custom queries, missing database indexes can turn a 10ms query into a 500ms one.
6. Audit and Reduce Plugin Overhead
Every active plugin adds processing time to every request. Some add a little. Some add a lot.
How to find the slow ones:
Use the Query Monitor plugin to see exactly how many database queries, HTTP requests, and PHP execution time each plugin contributes. Sort by "time" to find the worst offenders.
Common culprits:
- Broken or chatty plugins that run external API calls on every page load (social sharing plugins, real-time analytics, broken link checkers)
- Page builders loading assets globally instead of only on pages where they're used
- Plugins that aren't needed but were never deactivated. If you tried a plugin six months ago and forgot about it, it's still adding overhead.
The goal isn't zero plugins. It's zero unnecessary plugins.
7. Upgrade to the Latest PHP Version
PHP 8.x brought massive performance improvements through JIT compilation and optimized internal functions. The difference between PHP 7.4 and PHP 8.2+ on WordPress is measurable: 2 to 3 times faster execution on identical workloads.
Check your current PHP version in your hosting dashboard. If you're below 8.2, upgrading is one of the easiest TTFB wins available. Just test on a staging site first to confirm plugin compatibility.
8. Minimize DNS Lookup Time
DNS resolution is the first step in every request. If your DNS provider is slow, every visitor pays that penalty before anything else happens.
What helps:
- Use a premium DNS provider (Cloudflare, Route 53, or your host's integrated DNS). Free DNS from domain registrars is often slower.
- Reduce the number of external domains your page loads resources from. Each new domain requires a separate DNS lookup.
- Enable DNS prefetching for third-party domains you do need by adding a
dns-prefetch link tag to your theme's head section.
Putting It All Together: The Sub-200ms Stack
Here's what the full optimization stack looks like when everything is working together:
| Layer |
Technology |
What It Does for TTFB |
| Web server |
LiteSpeed |
Fastest PHP execution, built-in page caching |
| Page cache |
LSCache (server-level) |
Serves cached HTML without loading WordPress |
| Object cache |
KeyDB / Redis |
Reduces database query time by 30 to 50% on dynamic pages |
| CDN |
Cloudflare Enterprise (300+ locations) |
Serves cached pages from the nearest edge node |
| Database |
MariaDB (tuned) |
Faster query execution than stock MySQL |
| PHP |
8.2+ with OPcache |
2 to 3x faster execution than PHP 7.4 |
| Infrastructure |
Container isolation, auto-scaling workers |
Consistent performance under load |
When these layers work together, the result is a TTFB that consistently stays under 200ms for cached pages and well under 600ms even for dynamic, logged-in requests.
This is the exact stack that powers Levamo, delivering 353 requests per second under load testing and a 95% GTmetrix performance score out of the box.
What to Do Right Now
- Measure your current TTFB. Use PageSpeed Insights or GTmetrix. Test your homepage, a product page, and a logged-in page. Write down the numbers.
- Check your PHP version. If you're below 8.2, upgrade on staging first, then production.
- Verify caching is active. Check if server-level page caching and object caching are both enabled.
- Run Query Monitor for one day to identify slow plugins.
- Test from multiple locations. If your TTFB is great from one region but terrible from another, you need a CDN with edge caching.
If your TTFB is over 600ms after these steps, the bottleneck is almost certainly your hosting infrastructure. No plugin can fix slow hardware.